Introduction
Cohort analysis is a modern Data Analysis technique among Data Analyst and marketers but does we understand it? Are we using its full potential? Before answering this, I would like to explain the meaning/technique of Cohort analysis to the new Users.
What is Cohort?
A Cohort is simply a segment of users over a given period. For example, a cohort could be all users based on their Acquisition Date (in Google Analytics this is the Date of First Session) or in a simple term “A cohort is a group of people who share a common characteristic over a given period of time.” Another cohort might be all users that completed their first transaction during a particular time. The first transaction is a prevalent cohort used in eCommerce businesses. You’ll commonly hear eCommerce companies talk about the performance of new customers acquired during the holiday shopping season. This is simply a cohort. It’s all customers whose first transaction occurred between thanksgiving and Christmas (or some day before Christmas).
What is Segment?
A segment is a defined portion or section of something larger such as a database, geometric object, or network. The term is used in database management, graphics, and communications. In terms of Data Analytics, A segment is a subset of your Analytics data. For example, of your entire set of users, one segment might be users from a particular country or city. Another segment might be users who purchase a particular line of products or who visit a specific part of your site.
What is Cohort analysis?
Cohort analysis is a subset of behavioral analytics that takes the data from a given data set (e.g. an eCommerce platform, web application, or online game) and rather than looking at all users as one unit, it breaks them into related groups for analysis.
Problem Statement/Situation:
Mobile app/Game development or eCommerce companies look for user visits, app download, and average time spent on site, number of visitors etc if these numbers are good then to a lot of people in tech, this sounds like success. Gaudy download counts, user visits, average time spent on site and another big round of funding—you’ve made it. But to specialist Marketeer/Consultant, all of that was just the starting point. They know well that getting a Visitor/download means only you’ve gotten a foot in the door. The real work begins after that. Long-term success means not only getting someone to visit your website or download your app, but also getting them to come by day after day because you’ve built something that they can’t live without.
Possessing that must-have value proposition isn’t something you launch with, it’s something you achieve through close study, experimentation and iteration. To get there, you need to go beyond vanity metrics that only superficially measure growth and retention—like Visits, download counts and even daily active users / monthly active Users.
Well it’s not that bad people fall into this trap then make judgements on the performance of their store based on this information. The problem with this is that the experience is not the same for everyone. Here are the main reasons why:
Customer Lifecycle stage – Every prospect/customer is at a different stage in their lifecycle. This can be anything from Consideration, Purchase, Retention and Advocacy. They may have only just made their first purchase or are a loyal customer making their fourth purchase.
Website changes – It is highly likely that your website is going through multiple site changes as you try and optimise the user experience and run new marketing campaigns. Again, this means that the site experience can be dramatically different throughout the year.
You can now see how, because the experience is not the same for everyone, taking averages of your data for say a specific month can hide important information about how certain metrics are actually trending. Are they staying the same or actually have recent site improvements to the user experience had a positive effect on the spending habits of new cohorts? Now you need to dig deeper into your Analytics Data to identify how well your users are being retained and the primary factors that will drive growth for company.
What do we need to do to gain the maximum from Analytics data?
Most of us would have heard the quote from John Wanamaker, “Half the money I spend on advertising is wasted; the trouble is I don’t know which half” It dates back to the 19th century.
Since then we have evolved tremendously, new technologies have made Marketing/advertising more measurable and effective than ever. However, there’s still a considerable gap between what we can do from the huge data available to us from Analytics and CRM and This leads to significant under-optimization of advertising and marketing Money.
Well, there are many techniques that I feel can be used to minimise this– cohort analysis and Life time value.
Cohort analysis involves examining how specific characteristics change over time, either for a specific cohort or, more commonly, between similar groups of cohorts.
There are 2 main ways to break your users into cohorts for cohort analysis:
Acquisition cohorts: This Cohort is made up of users by when they signed up for your product/Website. By measuring the retention of these cohorts, you can see how long people continue to use your Website/app from their initial start point.
Behavioral cohorts: This Cohort is made up of users by the behaviors they exhibit in your Website/app within a given time frame. These could be any number of discrete actions that a user can perform — sharing your article over LinkedIn, downloading a report, starting a fame midway in mobile app, or any combination of these actions. A cohort will be a group of users who did those actions within a time frame that you specify. You can then look at how long different cohorts stay active in your app after they perform those actions.
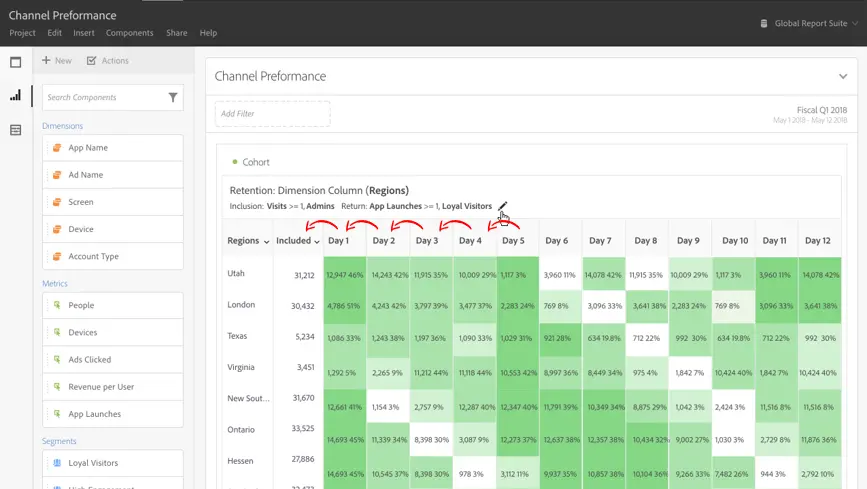
Cohorts analysis table – source : Adobe
From the table above we can observe the following:
- Clients that bought for the first time in January, spent on average $10 in January, $8 in their second month (February), $3 in their third month etc. Clients that bought for the first time in February, spent $11 in their first month, $8 in their second month, $7 in the third etc.
- We can observe a trend that clients spend on average more money during their first month throughout time. This would probably mean that either the quality of the products or user experience is improving.
- Clients that bought for the first time in January are spending only a small amount 5 months later.
A lot of other analytics tools have been hard on Google Analytics for its lack Cohort functionality – and that was well deserved! For a long time the only way to do cohort analysis in Google Analytics was via segmentation – but that was really a hack.
Now Google Analytics has a real Cohort report that makes it much easier to perform cohort analysis. If you are using Google Analytics than it would be nice to learn about Cohort reports.
Now we have learned about Cohort Analysis and Lifetime Value so what can we achieve with the help of these two? We can do so many amazing things like:
Assess conversion funnel improvements – You have full control to see and enable to what extent a change to the customer experience has improved the conversion rate for new customers. For example, if you are changing the color of CTA buttons are converting more customers on their first visit to your site.
Perform Channel acquisition analysis – If you break down your average revenue per channel for different cohorts on a month by month basis you can see if your optimisation efforts for particular channels are acquiring better customers.
Customer Frequency analysis – Determine if over time you are making new customers purchase more frequently following their first purchase.
To gauge whether assets that you bought from Image stocks are improving user engagement over time- Growth can sometimes mask engagement problems. For example, if you are acquiring a large amount of new users and just focus on how revenue is increasing then things can look great however under the hood you may find that as the months go by engagement drops off very sharply. Your good performance is only sustained by your rapid growth. Don’t fall into this trap.
So this Technique can provide a clear distinction between Growth and Engagement by providing a way to differentiate between growth metrics and engagement metrics.